Tackling the overwhelm: Simplifying estate management through digitisation
Things are feeling very serious right now. The Building Safety Act rightly carries enormous gravitas, and decarbonisation can feel like a steep mountain to climb. It's easy to get caught up in the details, and feel pretty overwhelmed in the process. But let's 'zoom out' a little bit to get some perspective.
Managing an estate used to be fairly simple. You needed to manage your existing buildings, and consider using the space you have to build new ones.
Well, perhaps it was never quite that easy, but for sure, things are more complicated now. As we built out our estates, we looked for faster, more efficient, more innovative ways to build our buildings.
And at some point, we lost control.
The safety of our buildings became questionable. Compliance and accountability over building safety was brought into the limelight.
We became consumers and as we consumed, we actually released far more carbon into the atmosphere than the atmosphere could ever absorb.
So, to get on top of those emissions, we have to set carbon targets. And carbon targets were set for estates and of course, every day our stock gets a little bit older, a little bit creakier: backlog maintenance hasn't gone away.
One bite at a time
Now, if you're a higher education estate, you've still got student experience to deliver, right? Because no students, no business. If you're a healthcare estate team, you're still dealing with a healthcare crisis. You're dealing with PFI hand back, you're looking at new hospital projects, and your goal is still to deliver better health outcomes. If you're a residential operator, you've still got tenant satisfaction scores to hit.
And now the Building Safety Act is pushing tenant engagement higher and higher up the agenda. It all became a little bit overwhelming.
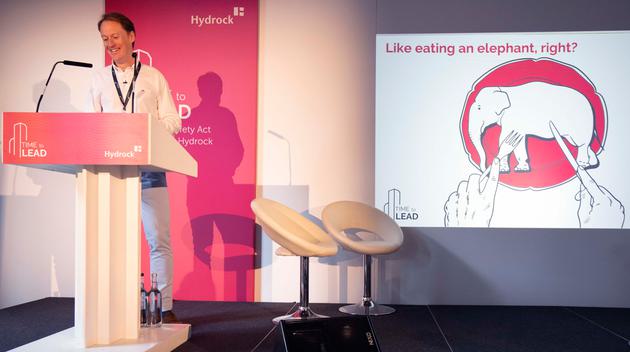
A bit like eating an elephant. And how do you eat an elephant? One bite at a time.
This is an old quote often used to describe overcoming an initial state of overwhelm with a really simple resolution: just make a start.
And the reason why we're talking about eating an elephant? It's not technically an insurmountable challenge, and it's the same with the Building Safety Act. It's the same with decarbonization. It's the same with backlog maintenance.
Collectively, we have all the skills to make our buildings safe. We ensure the fabric is robust, we define the escape strategy, we compartment the building. We make sure there is adequate access for fire services. Decarbonization: we have all of the skills. We insulate the building well, we decarbonize the heating, we switch to a green tariff. Backlog maintenance: it goes the same, gather the tasks, understand the resources, the downtime schedule.
So why does it feel so overwhelming?
It feels so overwhelming because, quite simply, we don't have enough resource, enough time, enough budget to get it all done now. Secondly, it doesn't feel like the task has been completely defined.
When we consider eating an elephant, we can see the end game. It's a defined task. When we manage an estate, it kind of goes on; it has no finite end.
“If we apply a simple layer of data visualisation, a large data set (like our giant spreadsheets) can be broken down into something much easier to consume.”
Using data to spot patterns
So, what are we going to do? The answer is in the data.
Now I should highlight that data in and of itself isn't the answer. But when you gather that data and you process it, you can analyse it and you can visualise it in the right way. A picture starts to come together.
People have shown me these spreadsheets, these almighty Excel spreadsheets and it's column after column, row after row, sheet after sheet of data and they're so proud of these things. But I'm looking at it thinking, "I haven't got a clue what's going on there". I'm starting to feel a little bit overwhelmed myself.
We, as humans, are incredibly good at spotting patterns. As we've evolved over millions of years, we've learned to track animals through the woods, and we've learned to know when we're under threat, through knowing the sights, the sounds, the smells.
If we apply a simple layer of data visualisation, a large data set (like our giant spreadsheets) can be broken down into something much easier to consume. Just like our elephant! Let's start to slice and dice the poor thing. The next challenge is for data analysis to offer insight.
If we look back at our three main challenges: building safety, decarbonization and backlog maintenance, we said it was overwhelming because we simply didn't have enough resource. The answer lies in prioritisation.
Letting the data tell us the story
Let's assume we've done our investigations, we've done our surveys and we've come to the conclusion that it's going to cost us £100 million to make our buildings safe, £100 million for decarbonization and £100 million for backlog maintenance. That makes £300 million, right?
Well, not really. Because this is all actually a giant Venn diagram. Lots of these challenges, these projects, these activities that we might undertake, they actually overlap.
Let's use an example estate. Let's start with a simple data set. We can ask:
Is the building over 18 metres or seven stories? Yes or no?
Do people sleep in the building? Yes or no?
Do vulnerable people use the building? Yes or no?
It is a very simple data layer, but it's starting to tell us a story. It's starting to tell us where we should prioritise our efforts. We can do the same thing for carbon. Let's take the metre readings and divide them by the square metres of the building to give us a carbon intensity.
Perhaps we want to look at this a different way - through the lens of the number of people on site. So, let's look at the amount of carbon released per building user. That's another data layer. Again, a simple approach can be applied for backlog maintenance spend per square metre or per person.
At the very highest levels, we can start to overlay these simple data sets to form a composite view. We overlay the data sets to understand where we should take our first bites, which projects and activities will give you best bang for your buck, and which ones are right at the centre of that Venn diagram.
At times, the challenge on your plate must feel pretty overwhelming, and it is going to be challenging, but I promise you it can be done. I want you to remember, you've got this start with simple high level data sets and allow them to lead you to the answer.
Keep the challenge manageable and make sure every project is as impactful as it can be. The answer is in the data, though you might not see it without visualisation. To guide you to those first juiciest and high value bites, but let the model do the work.
Before you know it, you'll be looking for your next elephant.
Stay informed with our dedicated newsletter featuring news and updates, the latest talking points and everything else you might need to know about the Building Safety Act. Sign up here.

